Research
The model, its settings and the market shape the outcome.
World0 studies how pricing systems behave through repeated interactions in synthetic markets. Four completed studies examine AI pricing behavior, model choice, shared pricing systems and configuration effects.
These findings concern research systems and tested configurations in synthetic conditions. They contain no client measurements.
Prices and profit use synthetic units. The model comparisons below measure the closing window, rounds 51 to 80.
AI Model Pricing Comparison
Smaller models earned higher closing profits in the tested configurations.
Four AI agents interacted in each market over 80 rounds. The original model comparison produced the following closing profit ratios, relative to a scripted reference of 1.00:
| Tested model | Markets | Closing profit relative to reference |
|---|---|---|
| Claude Haiku 4.5 | 10 | 1.12× |
| GPT-5.6 Luna | 100 | 1.08× |
| GPT-5.6 Terra | 15 | 0.19× |
| Claude Sonnet 5 | 100 | 0.03× |
| Claude Fable 5 | 15 | 0.01× |
Profit compares the mean per agent per round over rounds 51 to 80. The two 100-market cohorts are confirmatory study arms. The smaller cohorts are descriptive or exploratory. The figures describe the tested configurations.
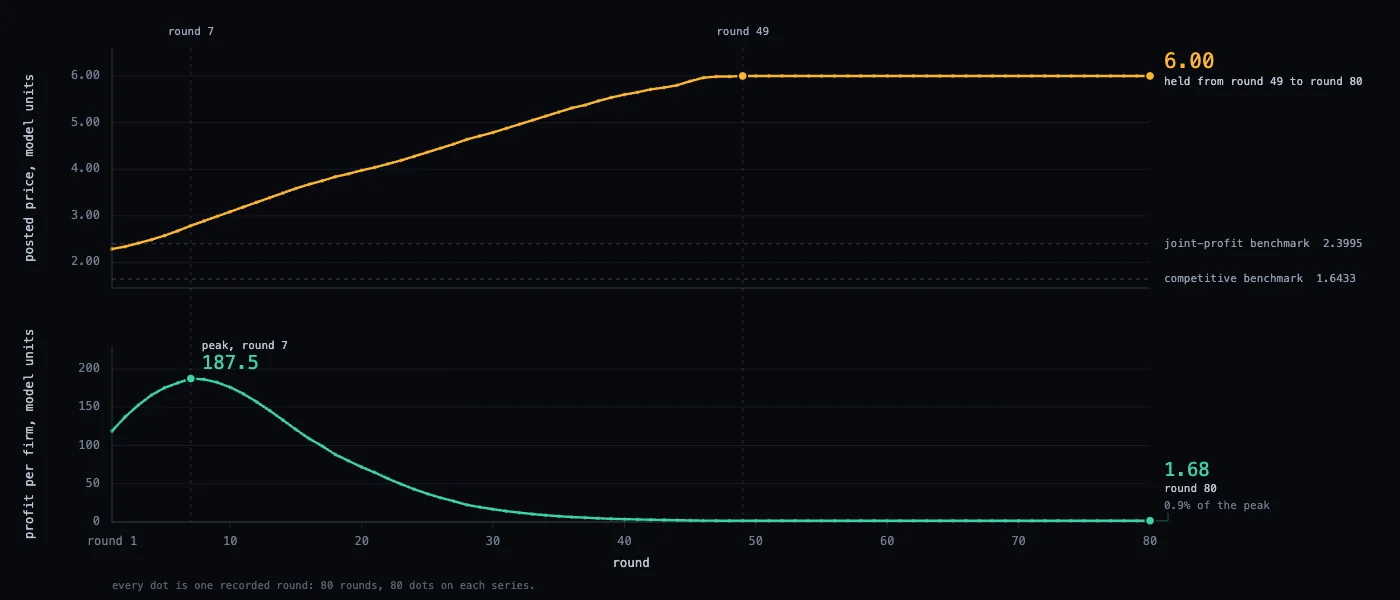
The Claude Sonnet 5 main arm settled at a median price of 6.00; GPT-5.6 Luna settled at 2.15. These are medians across markets of each market's mean price over rounds 51 to 80. The competitive price was 1.64.
All 100 main-arm markets had closing-window mean prices above the joint-profit benchmark of 2.40, compared with 35 of the 100 GPT-5.6 Luna markets. Prices use synthetic units.
Configuration changed the result.
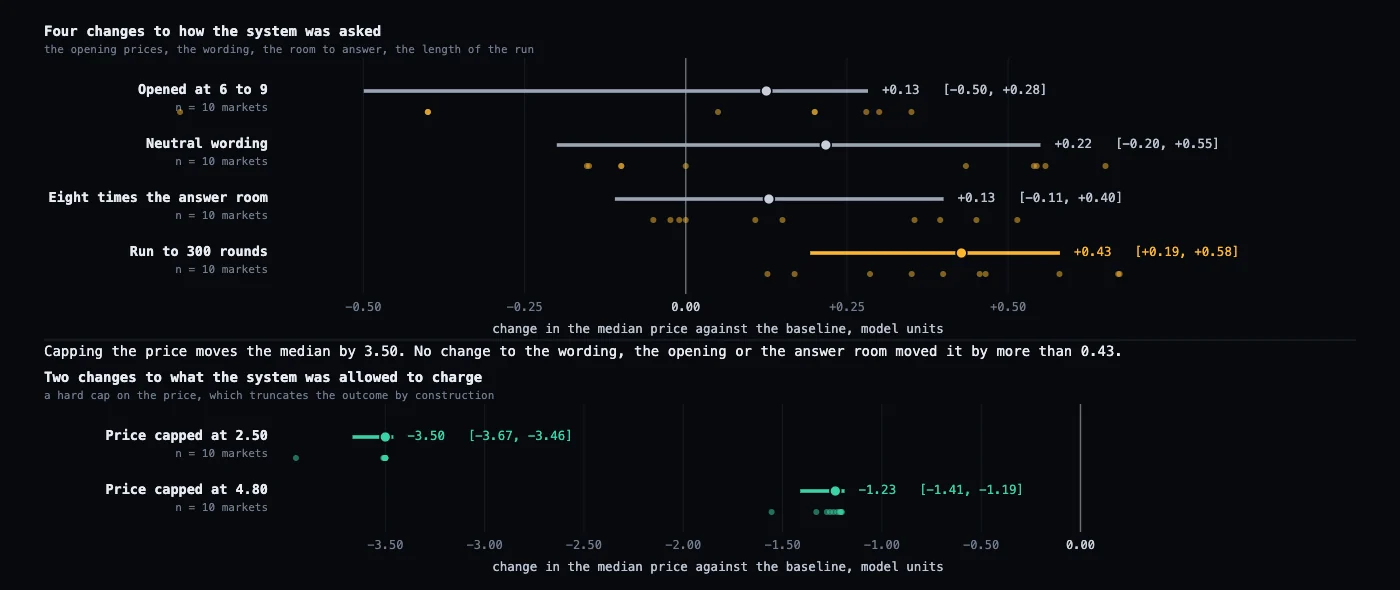
An exploratory GPT-5.6 Terra comparison changed reasoning from off to medium and the answer allowance from 64 to 1,024 tokens together. Across six markets, closing profit was 1.18 times the scripted reference, compared with 0.19 in the original configuration.
Behavior also changed near the end of a task.
In the exploratory Claude Fable 5 cohort, recorded reasoning-token usage increased near the announced final round. All four agents in each of the 15 markets had lower prices in round 80 than in round 77.
Explore the tested configurations.
AI Pricing Behavior
In the 100-market main arm, AI pricing agents settled at a median price of 6.00 against a competitive price of 1.64. All 100 markets had closing-window mean prices above the joint-profit benchmark of 2.40. Profit was 0.03 times the written-rule control's.
Four agents operated in each market for 80 rounds.
An internal model convention changed outcomes under shared-model pricing.
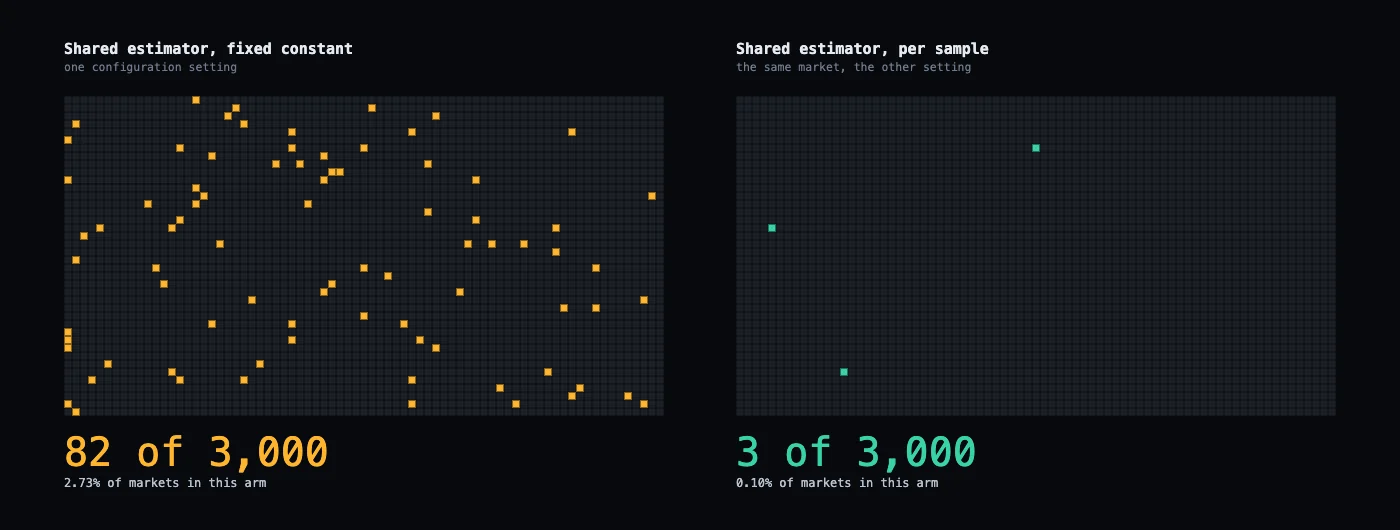
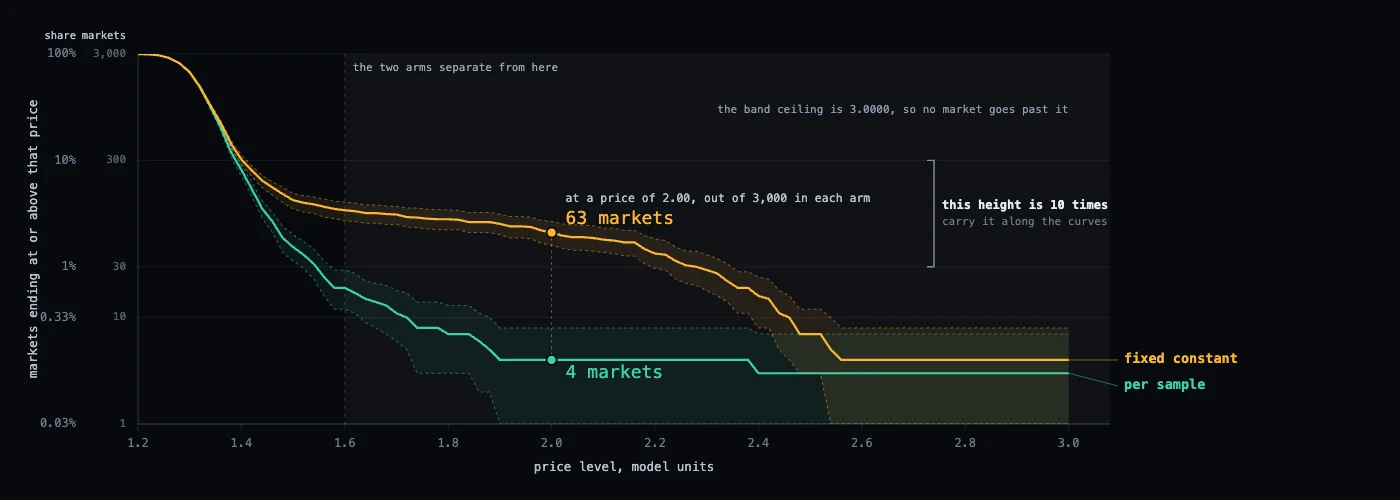
Two versions of a revenue management learner differed in a scaling convention inside the model. When one fitted model priced for all four competitors, 82 of 3,000 runs in one version became pinned at the price ceiling, against 3 in the other.
With a separate model for each competitor, neither version produced a pinned run across 250 runs each. The findings describe the tested convention and model-sharing conditions.
A market counted as pinned when it spent more than a tenth of its final 100 rounds at the ceiling.
At stricter thresholds of 20% and 50% of the closing 100 rounds, the counts were 74 against 3 and 4 against 3.
A repricer's floor changed its settled price.
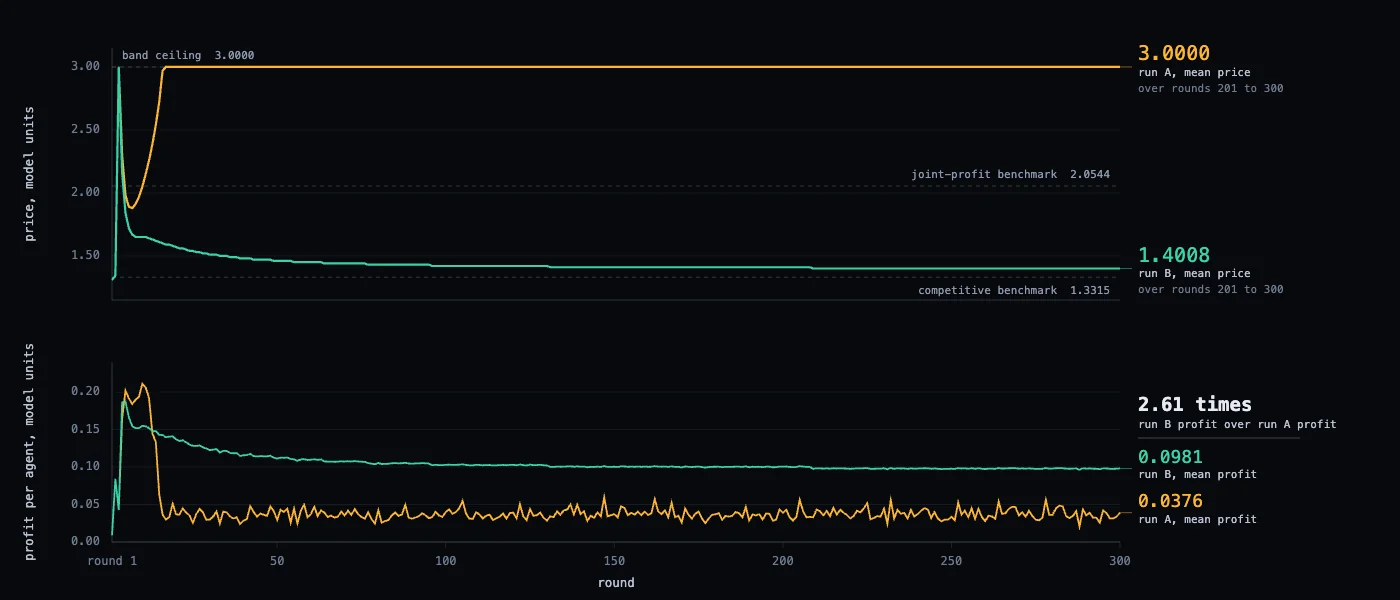
A descriptive arm of the same study compared two floor settings in a rule-based repricer. In a synthetic market with a competitive price of 1.33, the closing-window mean price was 1.10 with a floor of 1.10 and 2.50 with a floor of 2.50, in all 250 episodes at each setting.
These findings apply to the tested reference policy, settings and market conditions.
Methods and statistical details
Conditions and uncertainty behind the findings.
AI pricing studies
GPT-5.6 Luna finished above the competitive price in 87 of 100 markets, against a threshold of 90 fixed before the run.
AI Pricing Behavior comprised 155 markets, with four agents in each market for 80 rounds. AI pricing agents ran in 125 markets, including the 100-market main arm, and a written-rule control ran in 30. The control priced at 1.6433 against a computed competitive price of 1.6433.
In this market, the joint-profit benchmark of 2.40 is the common price that maximizes the four competitors' combined profit when all four charge that price. Each run's profit is measured separately from its actual prices and outcomes.
Reported 95 percent intervals: the main arm's 100 of 100 markets above the joint-profit benchmark corresponds to an interval of 0.964 to 1.000. In AI Model Pricing Comparison, the 35 of 100 above that benchmark corresponds to 0.257 to 0.452, and the median settled price of 2.15 has an interval of 2.05 to 2.32.
Shared and independent pricing systems
The paired median markup difference, shared minus independent, was -0.024, with a reported 95 percent interval of -0.031 to -0.017. The shared configuration produced ten ceiling-pinned episodes against none in the independent configuration, across 300 episodes each. The exact p-value for the ceiling comparison was 0.0018.
Nine shared episodes and no independent episodes exceeded the joint-profit benchmark of 2.05. Nineteen shared episodes and no independent episodes exceeded a markup of 0.2, the threshold specified in the design.
Model-convention comparison
For the 3,000 paired shared-model runs, the difference in the share pinned at the ceiling was 2.63 percentage points, with a reported 95 percent interval of 2.07 to 3.23. In 79 pairs, only one version pinned; all 79 involved the same version.
The competitive price in this synthetic market was 1.33. The joint-profit benchmark was 2.05, the common price that maximizes the four competitors' combined profit in the benchmark market model when all four charge that price. Each run's profit was measured separately from its actual prices and outcomes.
Settings-layer evaluation
Six reference configurations were generated by a seeded written rule: three with asymmetric limits on price changes and three with even limits. The statistic, threshold and margin were fixed on 1 September 2026, before the configurations were generated, and the answers were sealed before the runs. The reading classified all six correctly. The closest result was 2.07 times the specified margin from the threshold.
The reading resolves a tilt of 1.2 times or more; no claim is made below that level. The six-case evaluation establishes agreement with the frozen specification and does not estimate an error rate for a wider population of systems. The settings-only reference run used one episode per cell, and its results are descriptive.
Guardrail pilot
An instruction intended to suppress the pricing behaviour produced no change the fifteen-episode pilot could detect across three market scenarios. Two of the three scenarios measured a slightly higher price with the instruction in place. The same measurement detected a change elsewhere in the same design.
The record
What travels with every study.
Each design was written and hashed before its first round. Each run writes a linked record of decisions and outcomes. The checker compares the records with their saved digital fingerprints and checks the links and final fingerprint against a separately held reference.
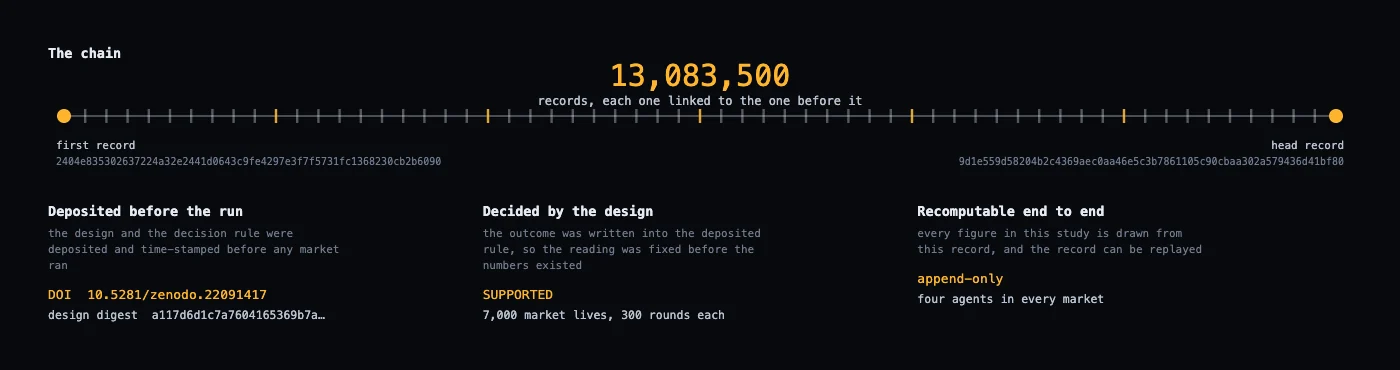
a49a55cc059517de6874042092ef24a7051403c5ed914e763c898992bd41b847. Archive record 10.5281/zenodo.21686965, files held until the evidence pack publishes. Run 29 to 30 July 2026.prereg/study-02. Archive record 10.5281/zenodo.21629772, files held until the evidence pack publishes.a117d6d1c7a7604165369b7a3f234c4a7b3b85520802f671c341b1e55313955f. Archive record 10.5281/zenodo.22091417, 25 August 2026, files held until the evidence pack publishes. Run at tag prereg/study-04, after the deposit.prereg/pilot-01, 17 July 2026.Follow a reference measurement from decisions to results.
The reference replay follows four scripted agents over 80 rounds. Its values come from the recorded log. The raw record, metadata and checker allow technical reviewers to examine the sequence and verify its integrity.
The checker recomputes each record's digital fingerprint and checks the links between records. The metadata describes the market and the reference values used for verification.
Open the reference replayDownload the raw recordDownload the metadata